This article is more than 1 year old
Hands on with neural-network toolkit LIME: Come now, you sourpuss. You've got some explaining to do
Everyone loves a manic pixel dream swirl
Deep learning has become the go-to "AI" technique for image recognition and classification. It has reached a stage where a programmer doesn't even have to create their own models, thanks to a large number available off the shelf, pre-trained and ready for download.
Training these models is essentially an optimisation exercise, something that involves some complicated (well, relatively) maths in order to reduce the number of errors on each cycle by adjusting a large number of internal weighting factors. At the end of the training phase, you should have a neural net that can accomplish the task it has been assigned.
The problem with neural nets (and deep learning) is that once they have been trained, we don't know what's going on inside them. The programmer will have set the number of hidden layers and neurons in the input and output layers along with the connections internally.
But once trained, a large network can be thought of as a black box for this simple reason: If I list the topology and all the internal weights and hand them to you, it would be nigh-on impossible for you to trace through and tell me the reason it classifies as it does.
Compare this to a traditional program. You could hand-debug it and explain how it works, and it might take some time, but it would be possible. Similarly, after studying the traditional program you could tell me the effect of changing one line in the program. In a trained neural net, you could not tell me the effect of changing one of the weights or removing a neuron without testing the network with inputs and looking at the outputs.
Worse, there could be other topologies of neural net that do the same job as well as the one I’ve just handed you, but from the outputs you couldn’t tell them apart.
And that’s an issue if, say, these pre-built models come with some form of in-built bias. Take financial services, for example, where that bias could present a problem like discrimination against possible customers based on factors such as a person’s race.
If a machine turns me down for a loan and that’s based on the colour of my skin then there is a good chance that’s not a good model. It would seem reasonable that the customer would want to know why the model turned them down. We, as those running the models, would want to know what’s going on inside the model, too, to identify and rectify the model.
Cor LIMEY – it's a reasonable explanation
So how do we get machine learning models to explain themselves? Step forward LIME. LIME is based on the work explained in a paper, "Why Should I Trust You?: Explaining the Predictions of Any Classifier" by Marco Tulio Ribeiro, Sameer Singh and Carlos Guestrin of the University of Washington in the US.
Although the original LIME is a few years old now, development continues on the original Python code, the Github site has a lively issues page, and pushes to the code continue.
In addition, on March 2018, an R package for LIME was made available on the CRAN repository that should see an upsurge in its usage in that community. Indeed there have already been a couple of conferences on the R package – and LIME itself is starting to be noticed at events such as Strata and indeed The Register's own machine learning conference this year.
The approach aims to explain in a model-independent way how a particularly trained model actually classifies, which means it can work with text classifiers, image classifiers or classifiers that work on tables of data. So, for an image classifier, the idea is to distort images and present them to the model to find out what features of the image the model is "firing" off. LIME is presented on this Github repo.
LIME has been in circulation for a couple of years, so how is it bearing up? I gave the Python implementation a shot.
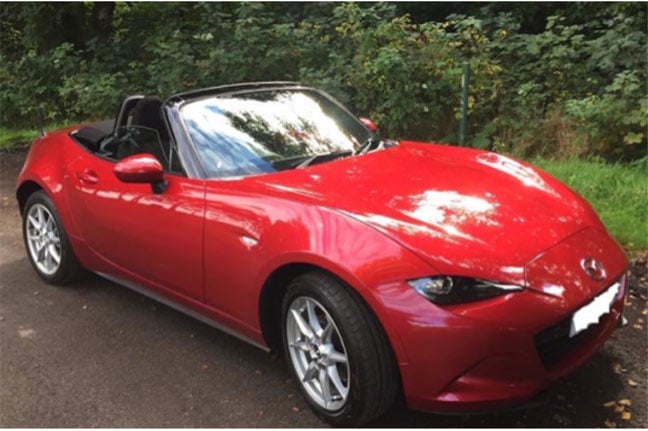
LIME can be used to explain a number of different classifiers but I limited myself to image classification. These can be simple binary affairs, Dog or Not Dog, or can classify images in to a large range of classes, often with a number that represents the probability that an image is indeed what the net thinks it is. Take, for instance, the image of a car, below.
Running this through a well-known image classification model produces the following output:
752 racer, race car, racing car 0.000552743
409 amphibian, amphibious vehicle 0.000703063
480 car wheel 0.00337563 582 grille, radiator grille 0.00342907
818 sports car, sport car 0.460375
512 convertible 0.467833
By far and away, the classification with the highest numbers are sports car or convertible with around 0.46. All others are less than 0.1. But why does the model think the picture concerned is a sports car, how can we be sure that the model isn't picking up on a feature that has nothing to do with a sports car? One classic example that is used to illustrate the problem is a classifier designed to recognise a husky or a wolf in a picture - see the original LIME paper here (PDF, 6.4 Do explanations lead to insights? on pages 8 and 9).
In this example, the classifier worked well, but once it was tested it was discovered that the classifier was actually firing off the snow in the background of pictures of wolves. This could be solved by using training sets that have fewer wolves with snow and more huskies with snow. In this case, it isn't really a problem but if a self-driving car had similar mistaken behaviour the result could be very bad indeed – it may, for example, have confused humans as ordinary objects an allowed the vehicle to have hit rather than avoid them.
Pixel panic
How well does the algorithm perform? Setting it up to work in LIME can be a bit of a pain, depending on your environment. The examples on Tulio Ribeiro's Github repo are in Python and have been optimised for Jupyter notebooks. I decided to get the code for a basic image analyser running in a Docker container, which involved much head-scratching and the installation of numerous Python libraries and packages along with a bunch of pre-trained models. As ever, the code needed a bit of massaging to get it to run in my environment, but once that was done, it worked well.
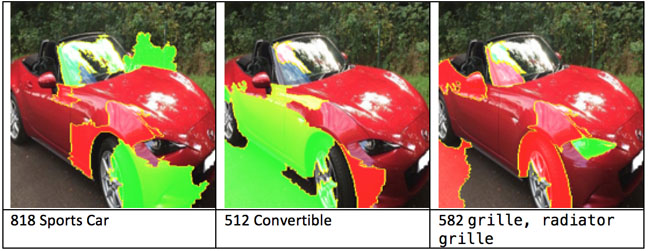
Below are three output images showing the explanation for the top three classifications of the red car above:
In these images, the green area are positive for the image and the red areas negative. What's interesting here (and this is just my explanation) is that the plus and minuses for convertible and sports car are quite different, although to our minds convertible and sports car are probably similar.
Even though we can see the highlighted pixels above, I think unless we can see the original images that the model was trained on, to form our own judgement, then it's hard to understand why the "Sports Car" and the "Convertible" see different sets of highlighted pixels.
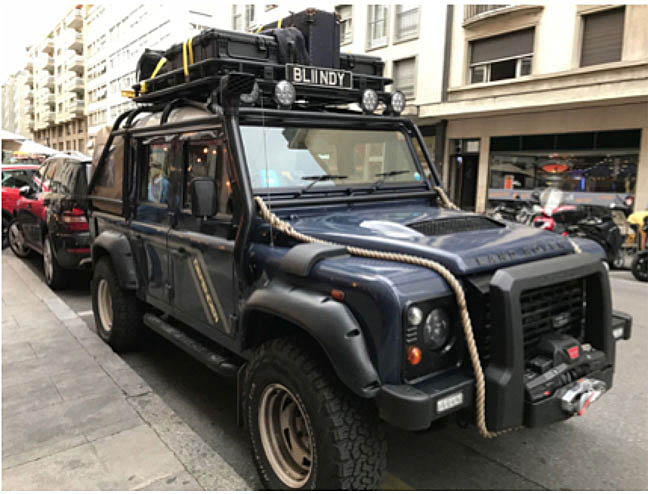
What about other cars? Can this model tell the difference between a sports car and a Land Rover, for example? Given the image below:
The top three explanations are:
804 snowplow, snowplough 0.00192881
865 tow truck, tow car, wrecker 0.00332598
610 jeep, landrover 0.977946
Jeep (I'll bet this training set was made in the US) and Land Rover are by far the most likely classifications, but what does LIME make of the image? What are the positive and negative areas for this classification?
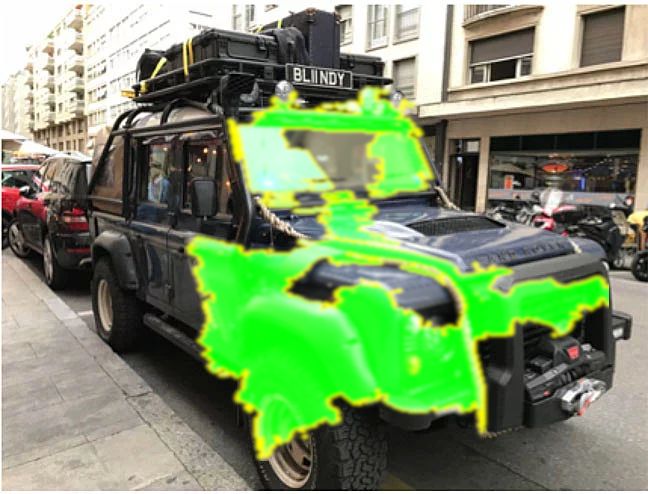
While this is similar to the sports car example, it seems the classifier is firing off the windscreen and the shape of the front of the vehicle. However, this is just my understanding and you might interpret the results differently – and that is a weakness of the approach: I am trying to interpret the output as best I can, but that is done using my experience and judgement and these may be limited and not impartial.
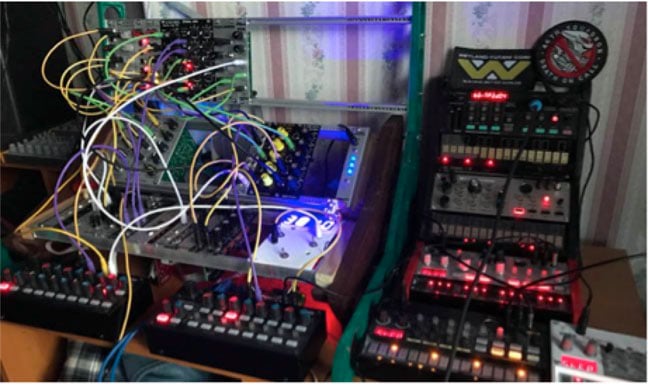
One final example: In the past, I've used the below image of a Eurorack Synthesizer to test classification models, mostly because I don't think many of them will have been trained with the image of such a beast.
This time the classifier produces the following output:
663 modem 0.00846771
755 radio, wireless 0.0624085
689 oscilloscope, scope, cathode-ray oscilloscope, CRO 0.890522
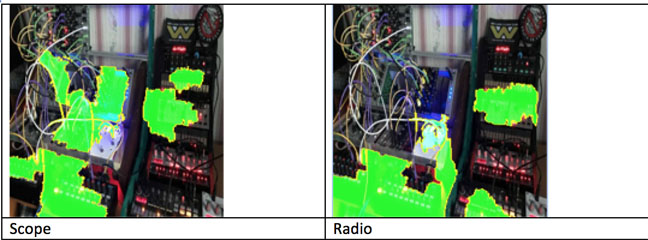
LIME produces the following as explanations for Scope and wireless:
There are some striking areas of similarity in the two explanations, but for me the most interesting inclusion in "Radio" is the central area with very bright digits. Is this similar to the tuning display of a radio? Again, having access to the original training set would be very useful.
For now, LIME is an interesting approach to the problem of the black box classifier. I think, though, that at the moment it belongs in the lab helping researchers pull out likely explanations for their under-development models. As a way of truly understanding the "reasoning" of the black box, it may have some way to go, especially if we really want to trust our machine learning decisions.
One major issue with the current implementations for LIME is the time it takes to produce explanations. With the image classifier, for instance, we noted that each image took around six seconds to get an explanation, and that's the Python implementation. I'm not sure how R performs but I'd be surprised if it wasn't even slower.
My code version of the image classifier can be found here. ®
